

How to Protect Your Money In the Market Crash
6 stocks flashing massive short signals right now
Valentine Roland
March 27, 2026

📰 In This Issue…
The market is weak, and the sectors that were holding up the indices are finally starting to crack.
When the market is in a confirmed downtrend, trying to find long setups is like trying to catch a falling knife. Instead, we adapt. We look for the stocks that tried to break out, trapped a bunch of eager buyers, and are now failing violently at their moving averages.
Remember the "Aha" Moment we talked about: If you ever feel confused looking at a downward trend, invert your chart's Y-axis. A terrible, crashing stock looks like a beautiful, picture-perfect breakout when flipped upside down.
Today, we are targeting two drastically weakening sectors—Semiconductors and Crypto Miners—and looking at the exact technical triggers that signal a massive leg down.
Here are the top short candidates on my watch list right now.
Remember: When stocks fall, they don’t crash for long so these are faster moves, its okay to sit out if not interested
Tech Short Candidates Right Now
$CORZ ( ▼ 7.39% ) (Core Scientific) – Shorting Candidate
-
The Macro Picture: A weak stock in a weak market, dragged down by a completely failing sector.
-
The Pattern: The chart has formed a textbook Head and Shoulders topping pattern, signaling major distribution.
-
The Trigger: It is currently failing right at the 50-Day Moving Average. This is the exact spot where institutions are unloading shares.

CORZ Daily
$CIFR ( ▼ 9.64% ) (Cipher Mining) – Shorting Candidate
-
The Pattern: The price action looks like an Inverse Ascending Triangle (a descending triangle breakdown). The floor is getting heavy.
-
The Trigger: The stock is trapped under a falling 50-Day Moving Average and is completely failing to cross above it. Every bounce gets sold.

CIFR Daily
⚙️ Semiconductors (Weakening Sector)
Context: Semis have been the undisputed market leaders, but the armor is cracking. When market leaders fail, they fail hard.
$AMD ( ▼ 7.49% ) (Advanced Micro Devices) – Shorting Candidate
-
The Macro Picture: Officially trading under a falling 10-Month Moving Average. The long-term trend has shifted.
-
The Setup: This looked like a "cheat" entry after a breakout, but it was a massive bull trap.
-
The Daily Trigger: The daily chart just failed hard at the falling 50-Day Moving Average. Furthermore, it completely filled its previous gap up, wiping out all that bullish momentum.
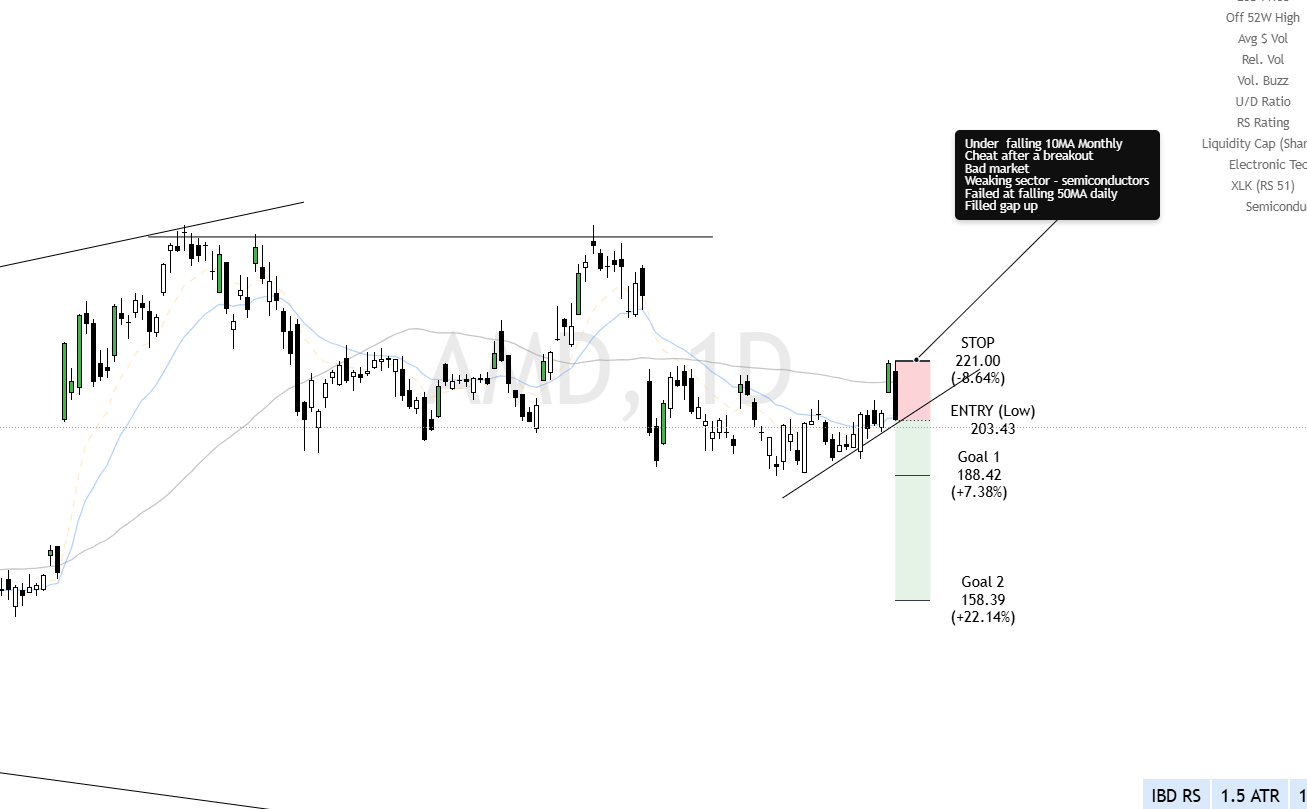
AMD Daily
$ALAB ( ▼ 5.59% ) (Astera Labs) – Shorting Candidate
-
The Macro Picture: Mirroring the broader semiconductor weakness. It is also trapped under a falling 10-Month Moving Average.
-
The Setup: Like AMD, this attempted a cheat after a breakout but failed entirely. In a bad market, these failed continuation patterns are prime shorting territory.
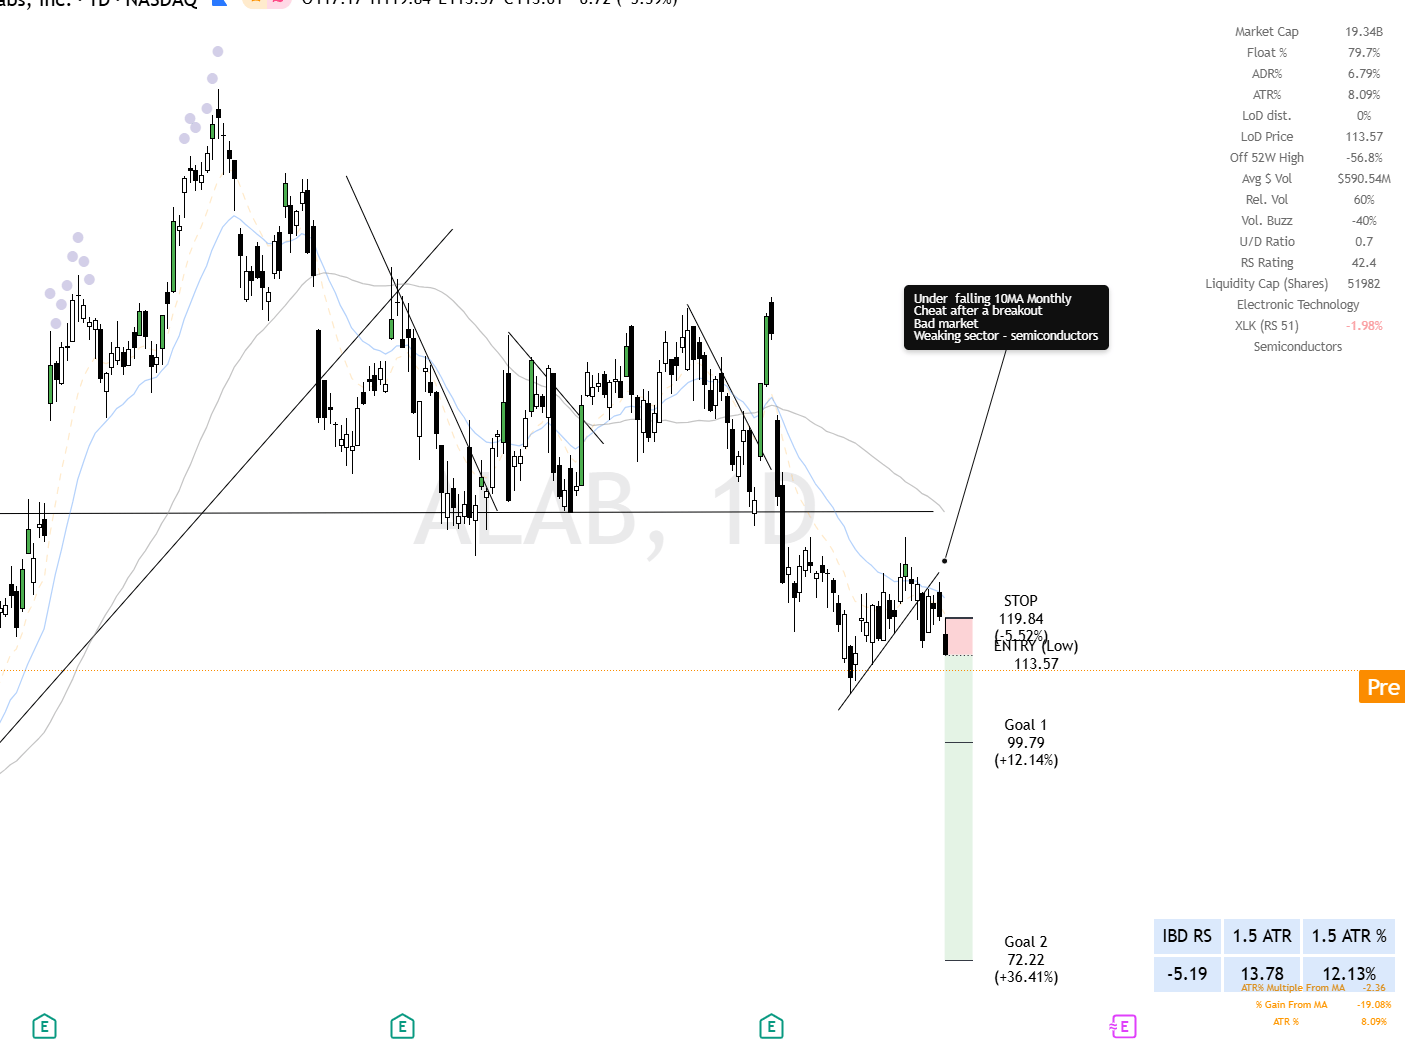
ALAB Daily
📉 General Market / Technical Breakdowns
$EAT ( ▼ 6.49% ) (Brinker International) – Shorting Candidate
-
The Setup: A brutal failed breakout on the monthly chart. When a long-term breakout fails, the reversal is usually vicious.
-
The Pattern: We are seeing an Inverted VCP (Volatility Contraction Pattern). The bounces are getting tighter, but to the downside.
-
The Trigger: Failing right at the falling 50-Day Moving Average.
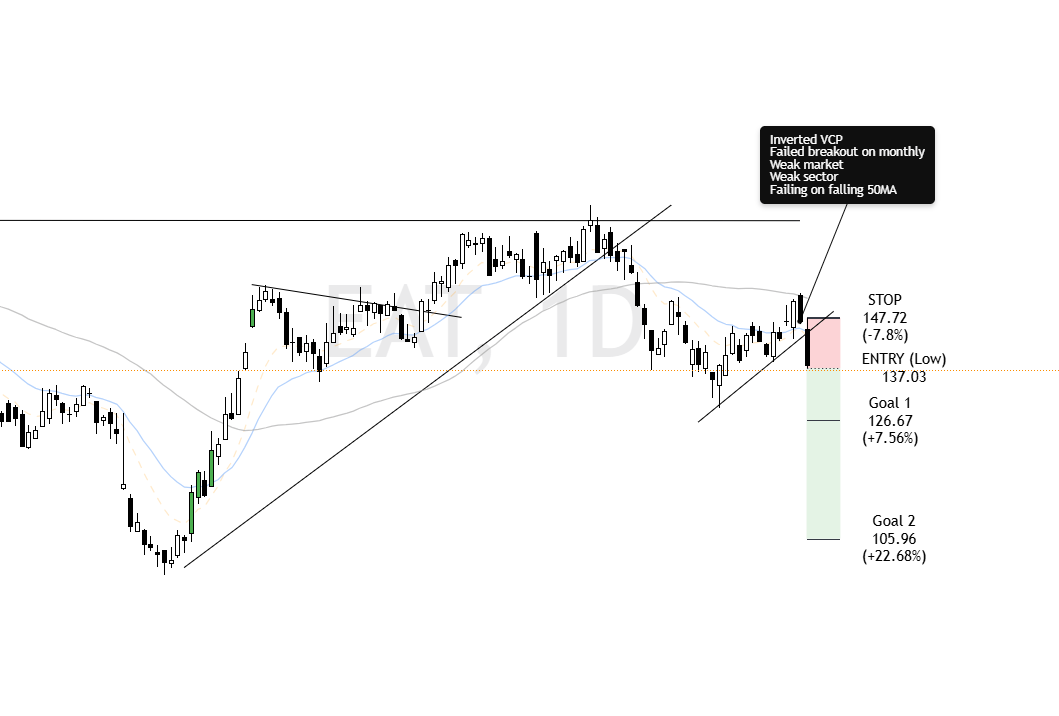
EAT
$CRWV ( ▼ 8.14% ) – Shorting Candidate
-
The Setup: A completely failed upside swing! It lured buyers in and then reversed hard.
-
The Pattern: After a 3-month consolidation, it formed a Head and Shoulders Top (an inverted head and shoulders on the upside).
-
The Trigger: It suffered a massive breakdown through a major long-term trendline. It is now executing a textbook "check back" pullback to a falling 20-Day Moving Average. Look for the rejection here.
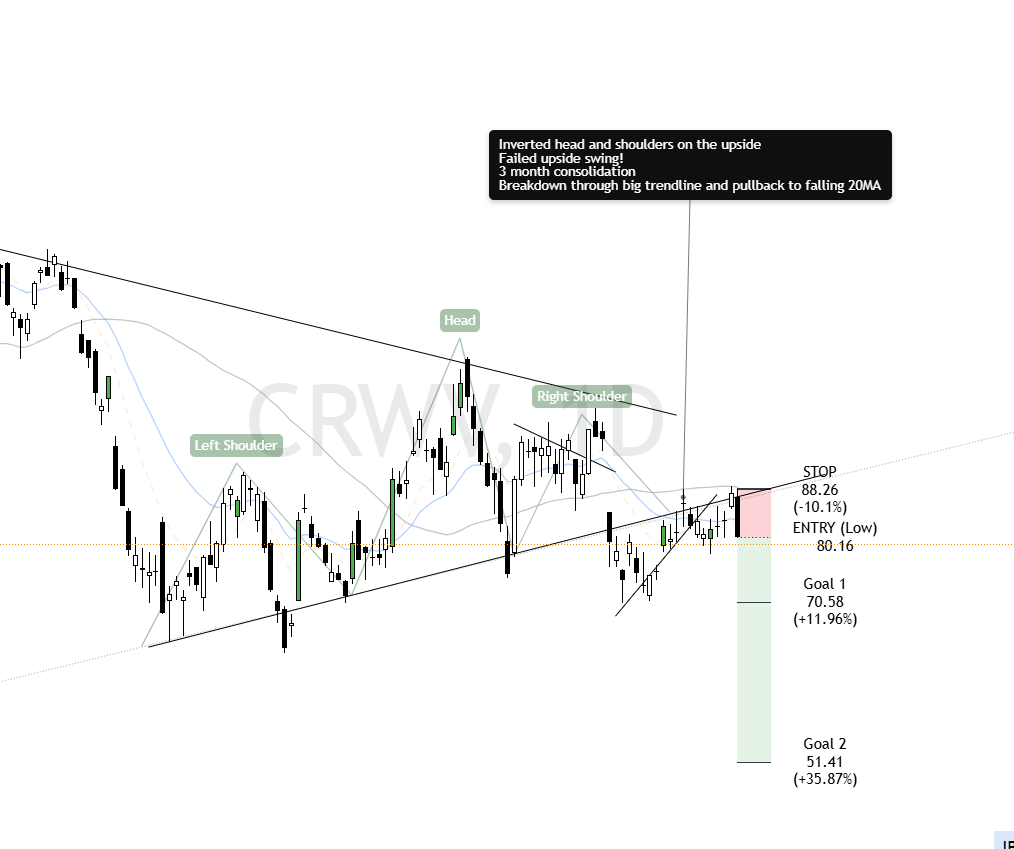
CRWV Daily
📊 Trading Framework Reminder
Remember: Every long-term investment alert can also be played as a swing trade. When shorting, risk management is even more critical.
🦅 Long-Term Investors (3-12 Month Holds)
-
Entry: Full position on breakdown.
-
Profit Taking: Cover 1/4 to 1/5 at Goal 1.
-
Exit Signal: Close above 20-day EMA (your trend guide) or 50-day EMA.
-
Why? Strong moves are hard to time at the bottom, but the 20EMA acts as a reliable trend filter.
⚡ Swing Traders (2-6 Week Holds)
-
Entry: Full position on breakdown.
-
Profit Taking: Cover 1/3 at Goal 1.
-
Final Exit: Cover the remainder at Goal 2.
💬 How Did We Do?
We’d love to hear your thoughts on this week’s alert!
Was it helpful? Did anything stand out to you? Your feedback helps us improve and keep delivering top-tier insights.
👉 If you're enjoying your premium membership, consider leaving us a quick review — it means a lot!
Regards,
Valentine
