

Don't Panic. Short the Market. 📉
How to profit from the crash (and the exact shorts we are taking)
Valentine Roland
March 23, 2026

📰 In This Issue…
The stock downtrend continues, and the technical damage is getting real. The Nasdaq 100 is now trading below both the 10-week and 30-week moving averages. Even worse, the 10-week just crossed under the 30-week moving average. In technical trading, this is a classic sign of a massive, Stage 4 downtrend.
But you do not have to be scared. We have witnessed artificial, headline-driven market crashes before. Look at the 2020 COVID crash—the market dropped over 30% but ended the year up over 15%. The exact same thing happened in 2025 during the Donald Trump tariff shock; we saw a rapid 25% drop, only to finish the year up 15%.
These types of bear markets are often "artificial." Eventually, the government steps in, prints money, solves the liquidity problem, and the market returns to normal.
So, what does this tough environment mean for you? It brings two massive opportunities, and Profit Punch is here to guide you through both:
-
Profit on the way down: We are going to find the best, most vulnerable setups and short the market.
-
Stalk the future leaders: The stocks that hold up well and refuse to crash right now are going to be your biggest gainers when the market eventually comes back to life.
Let's dive into the strategy.
🧠 The "Aha" Moment: Inverting the Chart – Study this again!
Shorting can feel unnatural because we are trained to look for stocks going up. But the truth is, shorting is just longing, inverted.
If you know how to find a good stock to buy, you already have the skills to find a good stock to short. You just have to look for the exact opposite setups.
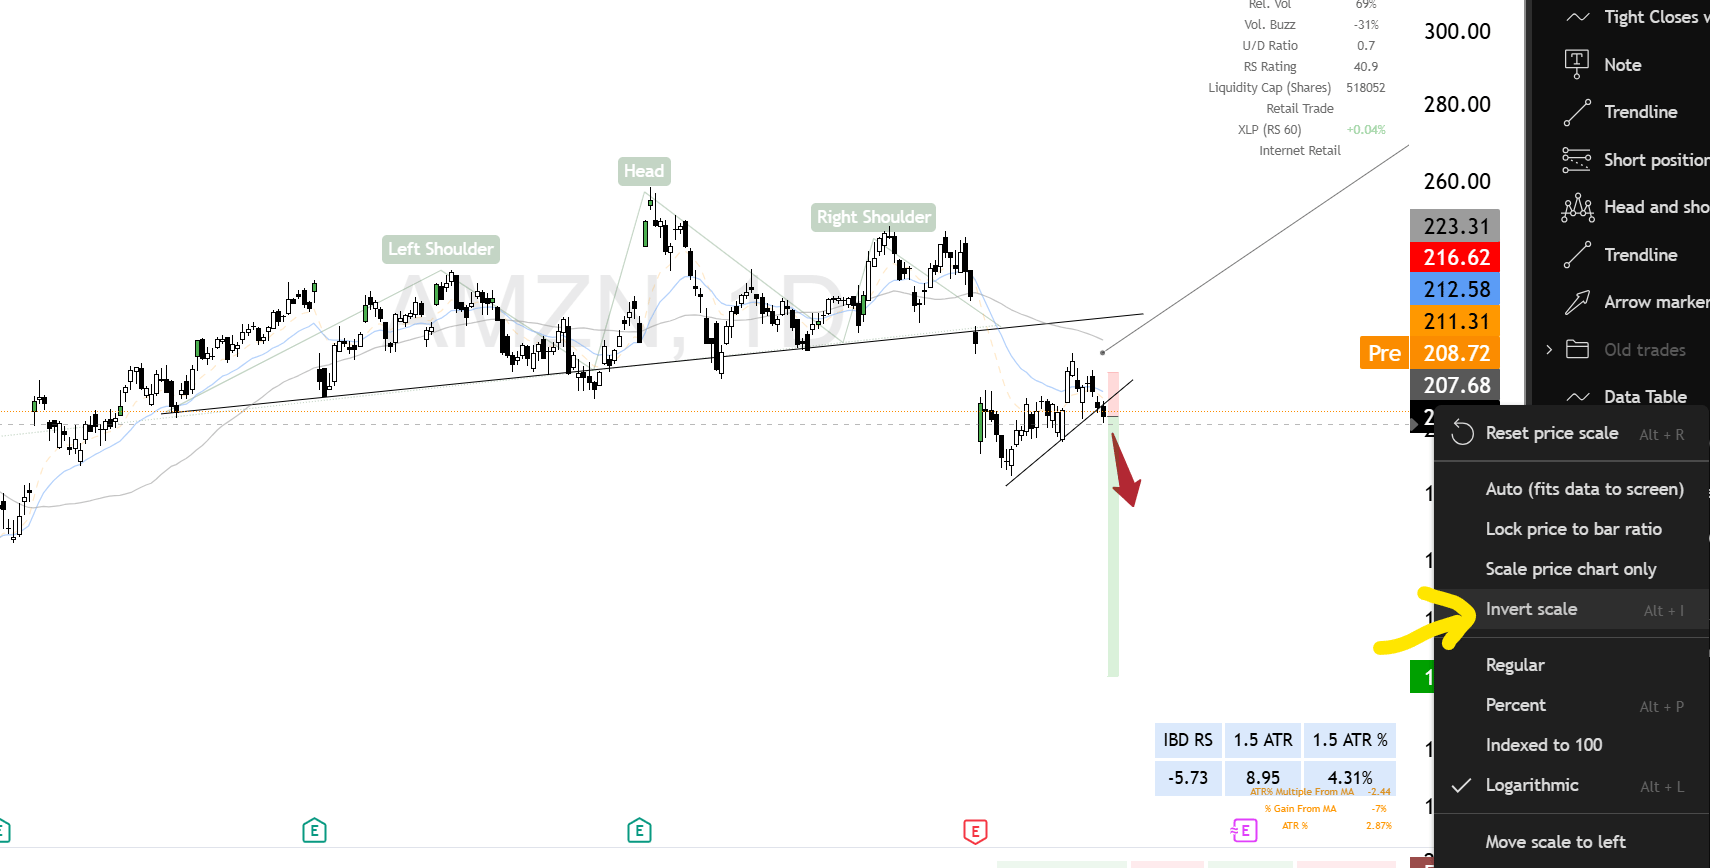
AMZN Daily Chart
If you ever feel confused looking at a downward trend, there is a simple trick: invert your chart's Y-axis.
Suddenly, a terrible, crashing stock looks like a beautiful, picture-perfect breakout. It removes the psychological friction and helps you see the true price action.
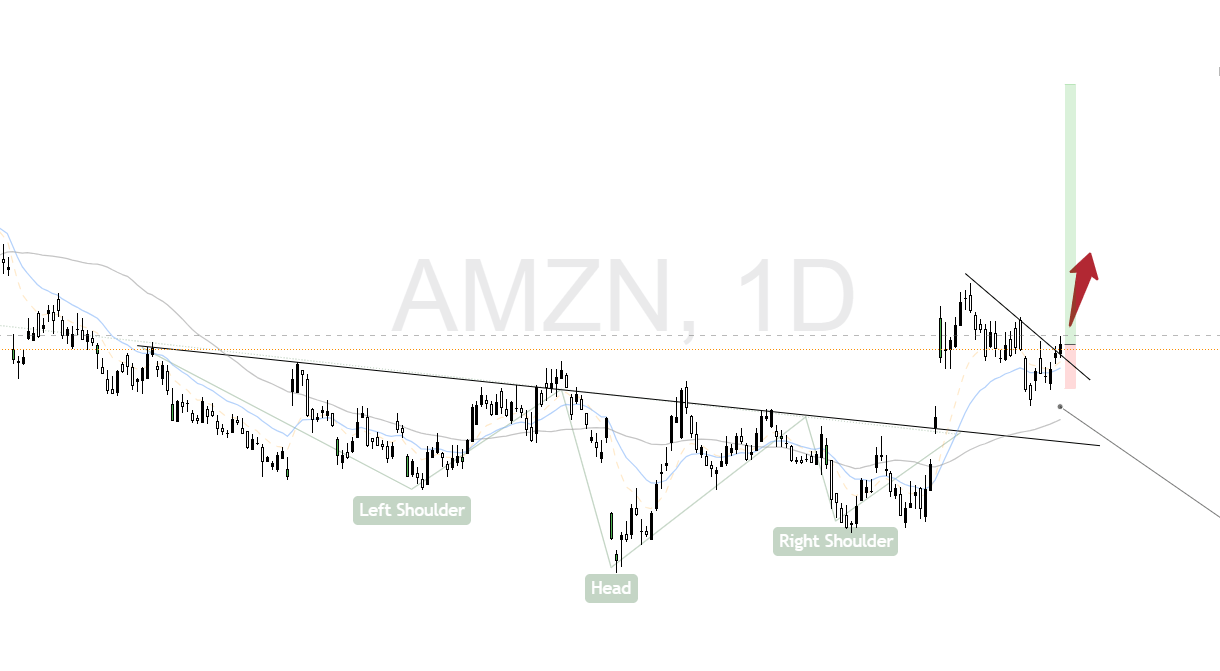
AMZN Daily Chart Inverted
Tech Short Candidates Right Now
$NATG ( 0.0% ) – (Natural Gas) – Shorting Candidate
-
The Setup: We are seeing a massive VCP (Volatility Contraction Pattern) breakdown and a double top on the monthly chart. If you invert this chart, it looks like a textbook inverse VCP ready to explode.
-
💡 Profit Punch Tip: Use the $KOLD ( ▲ 2.43% ) (ProShares UltraShort Bloomberg Natural Gas) ETF for 2x leveraged exposure to this downside move.

Natural Gas Daily

KOLD Daily
Data processing Short Candidates Right Now
$IREN ( ▼ 0.89% ) – Shorting Candidate
-
The Context: The market is realizing their AI data center expansion is going to be incredibly expensive, and their core Bitcoin mining margins are shrinking fast. Investors are jumping ship.
-
The Setup: A victim of a bad market and a crashing sector. The stock is trapped under a falling 50-Day Moving Average and is actively failing to test it. This is a classic Inverse VCP breakdown.

IREN Daily
$HUT ( ▼ 5.35% ) – Shorting candidate
-
The Setup: A completely failed upside swing that broke down through a major long-term trendline.
-
The Pattern: Forming an inverted head and shoulders on the upside after a 3-month consolidation.
-
The Trigger: Currently executing a textbook pullback to a falling 20-Day MA.

HUT Daily
$WULF ( ▼ 4.07% ) – Shorting candidate
-
The Context: Despite their strong "nuclear/green energy" narrative, their stock price is still fundamentally tethered to Bitcoin. As crypto bleeds, their premium valuation multiple is getting slashed.
-
The Setup: A completely failed upside swing that broke down through a major long-term trendline.
-
The Pattern: Forming an inverted head and shoulders on the upside after a 3-month consolidation.
-
The Trigger: Currently executing a textbook pullback to a falling 20-Day MA.
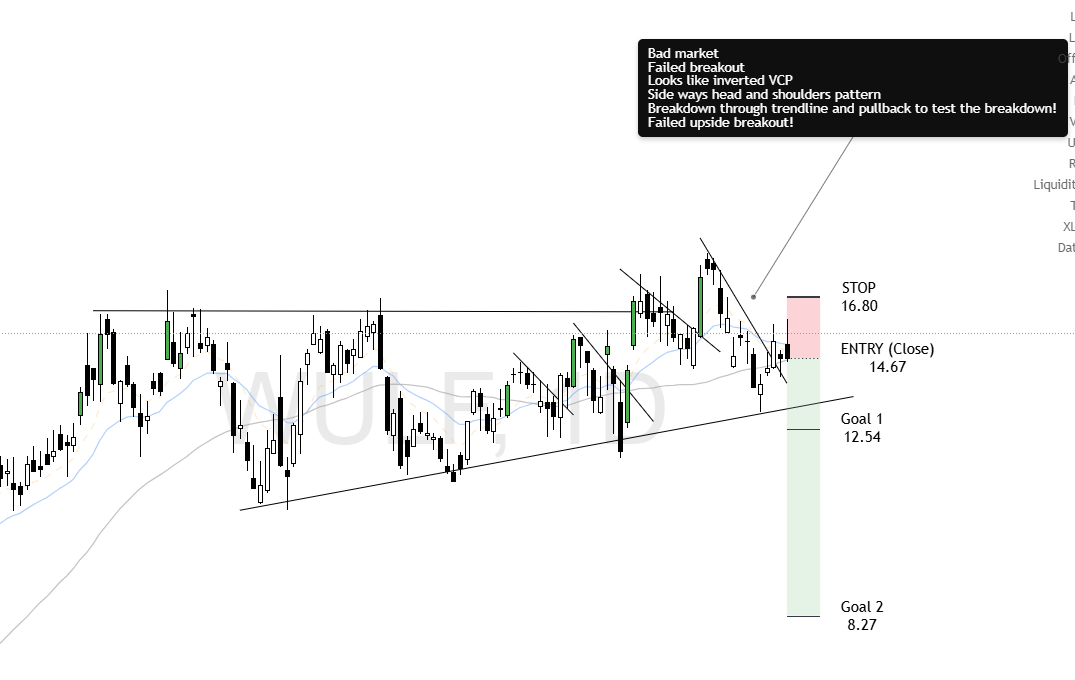
WULF Daily
Data processing Short Candidates Right Now
$SEZL ( ▼ 0.14% ) – Shorting candidate
-
The Context: The "Buy Now, Pay Later" (BNPL) space is a canary in the coal mine for the U.S. consumer. As credit cards get maxed out and retail spending slows, Sezzle faces a massive risk of rising default rates.
-
The Setup: This stock is in a confirmed Stage 2 downtrend (10MA < 30MA on the weekly chart).
-
The Pattern: We have a clear Double Top formation breaking down into what looks like an Inverse VCP.

SEZL Daily
Crypto Shorting
$BTC ( ▲ 3.17% ) – Shorting candidate
-
The Setup: We saw multiple deliberate "shakeouts" on the upside to trap eager retail buyers. BTC poked its head above a falling 50-Day Moving Average (faking a breakout), but then completely failed to hold it as support and crashed back below.
-
Officially in a Stage 4 downtrend (10MA < 30MA on the weekly chart).
-
-
💡 Profit Punch Tip: Use the $BITI ( ▲ 0.12% ) (Inverse Bitcoin ETF) to play the downside.
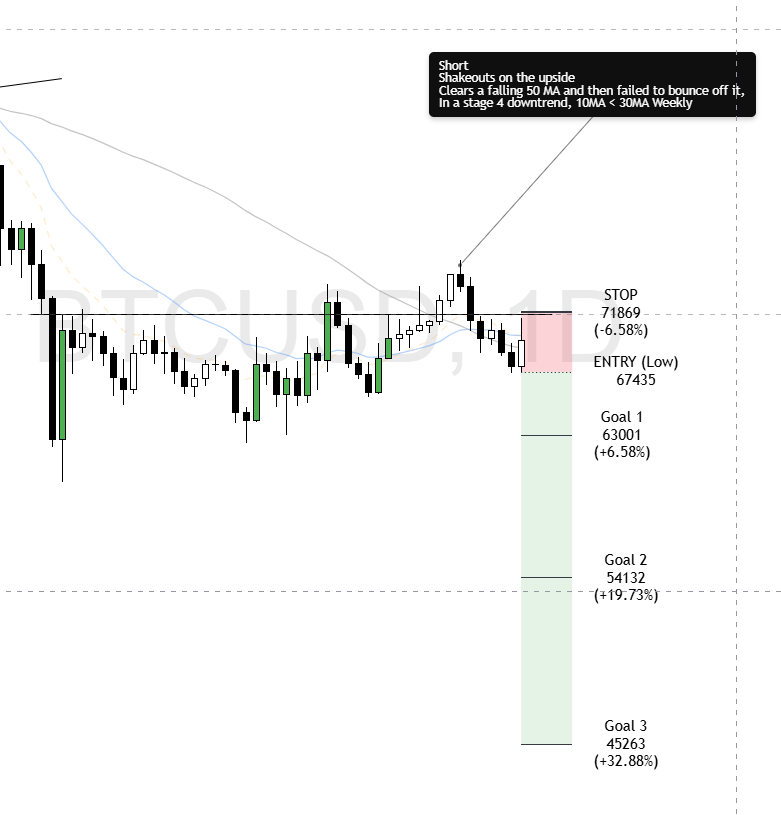
BITCOIN Daily
$ETH ( ▲ 4.15% ) – Shorting candidate
-
The Setup: Mirroring Bitcoin. Upside shakeouts followed by a failed retest of the falling 50-Day MA.
-
The Trend: Stage 4 downtrend confirmed on the weekly chart.
-
💡 Profit Punch Tip: You can also $ETHD ( ▲ 0.78% ) inverse x2 ETF to capitalize on this breakdown.
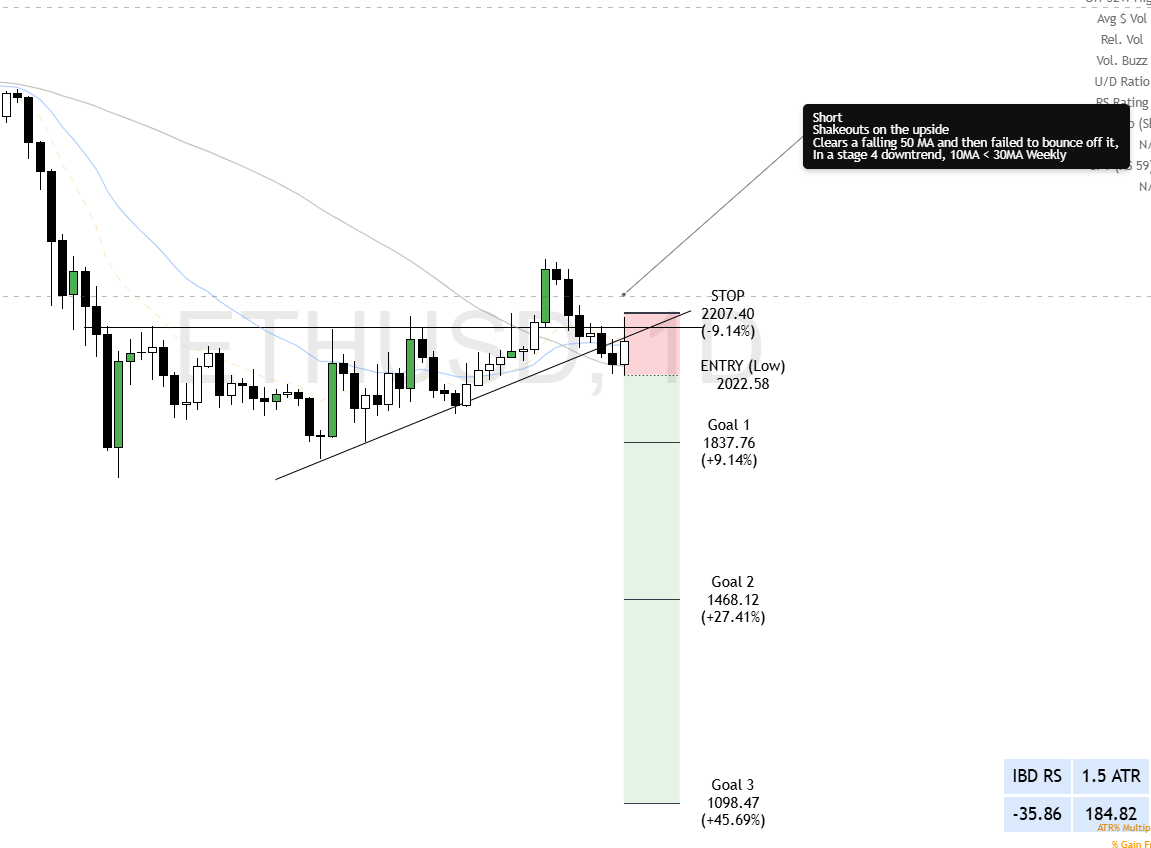
ETHEREUM Daily
📊 Trading Framework Reminder
Remember: Every long-term investment alert can also be played as a swing trade. When shorting, risk management is even more critical.
🦅 Long-Term Investors (3-12 Month Holds)
-
Entry: Full position on breakdown.
-
Profit Taking: Cover 1/4 to 1/5 at Goal 1.
-
Exit Signal: Close above 20-day EMA (your trend guide) or 50-day EMA.
-
Why? Strong moves are hard to time at the bottom, but the 20EMA acts as a reliable trend filter.
⚡ Swing Traders (2-6 Week Holds)
-
Entry: Full position on breakdown.
-
Profit Taking: Cover 1/3 at Goal 1.
-
Final Exit: Cover the remainder at Goal 2.
💬 How Did We Do?
We’d love to hear your thoughts on this week’s alert!
Was it helpful? Did anything stand out to you? Your feedback helps us improve and keep delivering top-tier insights.
👉 If you're enjoying your premium membership, consider leaving us a quick review — it means a lot!
Regards,
Valentine