

How to profit when the market drops
My exact strategy
Valentine Roland
March 16, 2026

Welcome back to Profit Punch.
When the market environment is good, we want to be looking for stocks to long. But when the market turns—as we are seeing right now with indices like the S&P 500 and the NASDAQ struggling—our strategy needs to adapt.
Today, I want to share my notes on how I look for stocks to short, and how you can actually profit from a downward trend.
The biggest secret? It’s much simpler than you think.
🧠 The "Aha" Moment: Inverting the Chart
Shorting can feel unnatural because we are trained to look for stocks going up. But the truth is, shorting is just longing, inverted.
If you know how to find a good stock to buy, you already have the skills to find a good stock to short. You just have to look for the exact opposite setups.
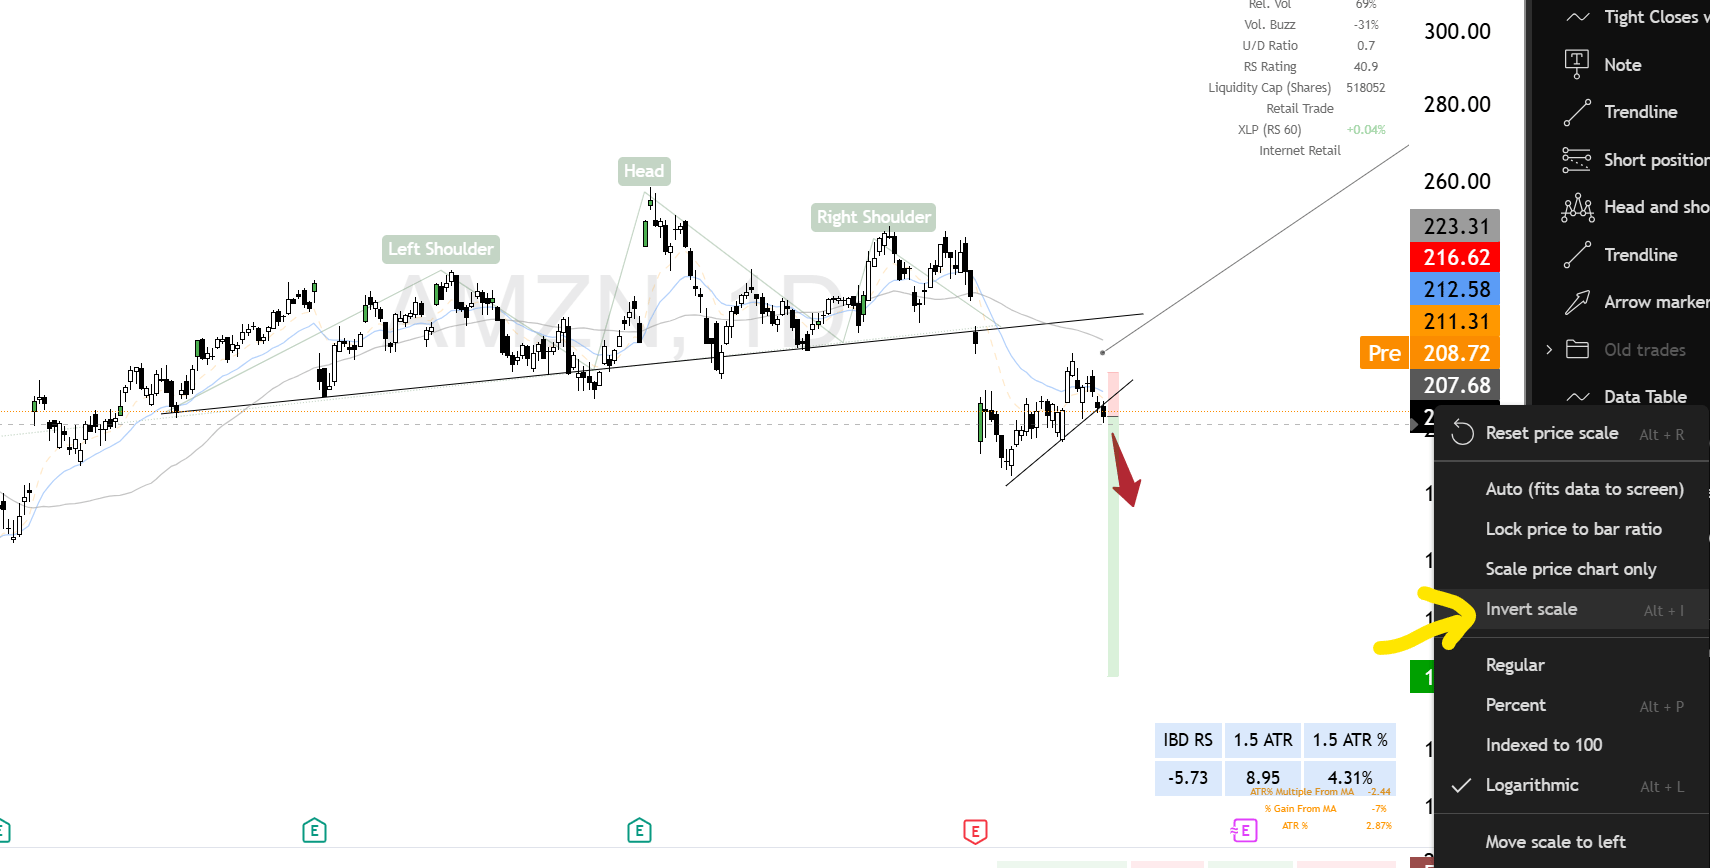
AMZN Daily Chart
If you ever feel confused looking at a downward trend, there is a simple trick: invert your chart's Y-axis.
Suddenly, a terrible, crashing stock looks like a beautiful, picture-perfect breakout. It removes the psychological friction and helps you see the true price action.
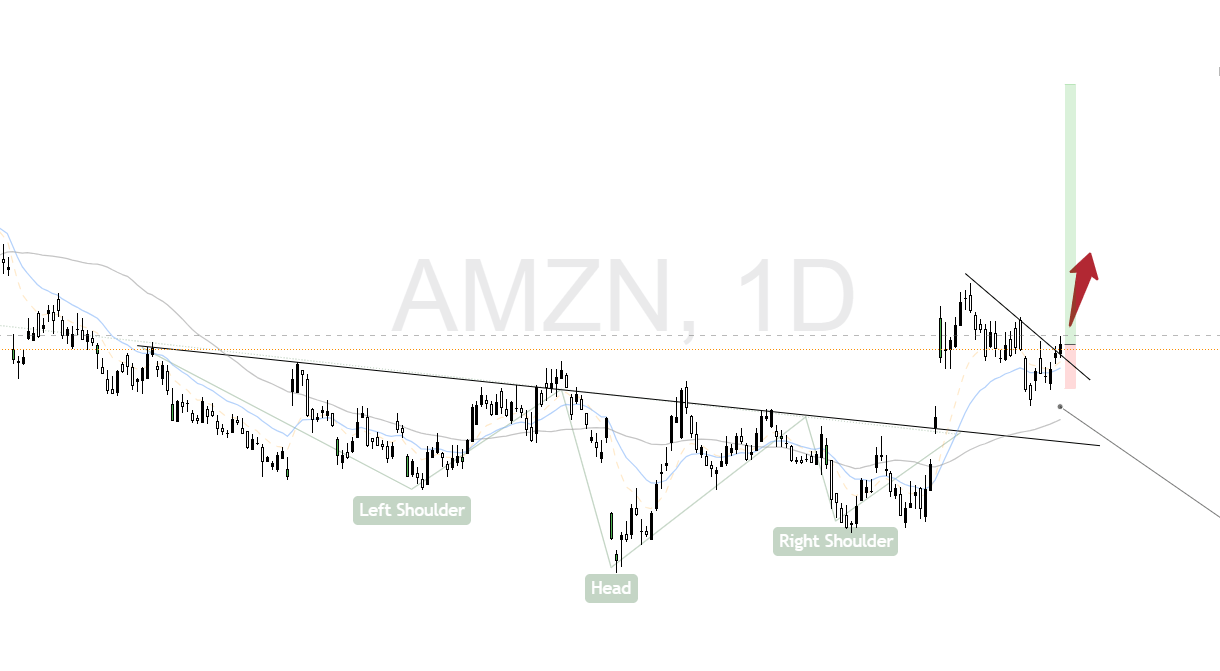
AMZN Daily Chart Inverted
The Two Main Short Setups
Before we look at individual stocks, we need to understand what makes a prime candidate for a short. There are two main setups I look for:
Setup A: The Failed Breakout (Trend Reversal) This happens when a stock has been in an uptrend, tries to break out to new highs, but completely fails. It creates a "fake out" that traps eager buyers. When those buyers panic and sell, the momentum reverses, turning an uptrend into a downtrend.
Setup B: The Failed Recovery (Trend Continuation) This happens when a stock is already in a free fall. It tries to bounce and recover, but it fails to hold the momentum, gets rejected at a resistance level (like a moving average), and continues its free fall.
The beautiful irony of the market: Many stocks that are perfect short candidates today were actually previously great setups to go long. They just failed to execute. When a great long setup fails, it often becomes a great short.
Need Help Timing These Trades?
The charts below will show you the "what" and the "why," but the "when" is the hardest part of trading. Shorting requires precise timing because the downward moves happen fast.
If you want to know exactly when I am entering these positions, where I am placing my stops, and when I cover for profit, I share my real-time portfolio updates in Profit Punch Premium.
We are currently running a 40% OFF promotion for new members. I showed you the what, join Premium for the when.
Tech Short Candidates Right Now
$META ( ▼ 3.83% ) – Shorting candidate
-
The Setup: We saw a failed gap up resulting in a massive upside shakeout that trapped buyers.
-
The Pattern: Forming an inverted head and shoulders topping pattern following a 4-month consolidation.
-
The Trigger: The recent gap down confirms the momentum shift. Remember, failed longs are prime short candidates.
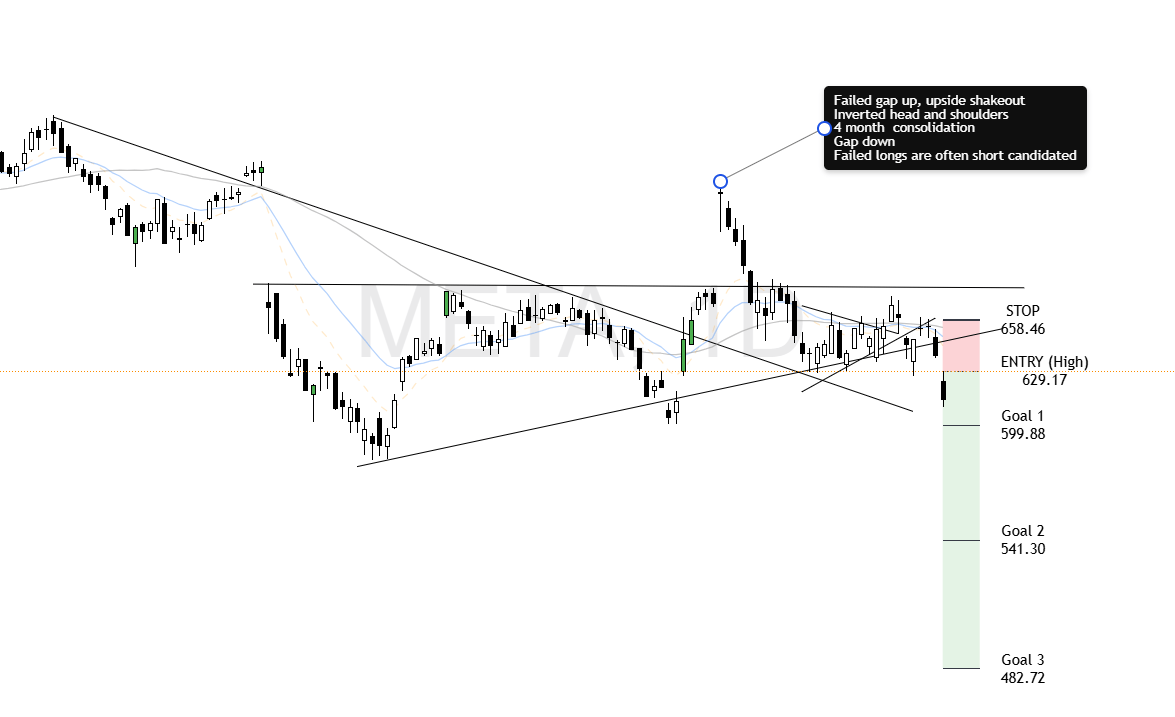
META Daily
$AMZN ( ▼ 0.89% ) – Shorting candidate
-
The Setup: A massive breakdown triggered by a bad earnings reaction, snapping a 4-month consolidation phase.
-
The Pattern: A clear head and shoulders topping pattern.
-
The Trigger: The stock is currently executing a pullback to a falling 50-Day SMA, creating an inverted wedge. Look for the rejection here.
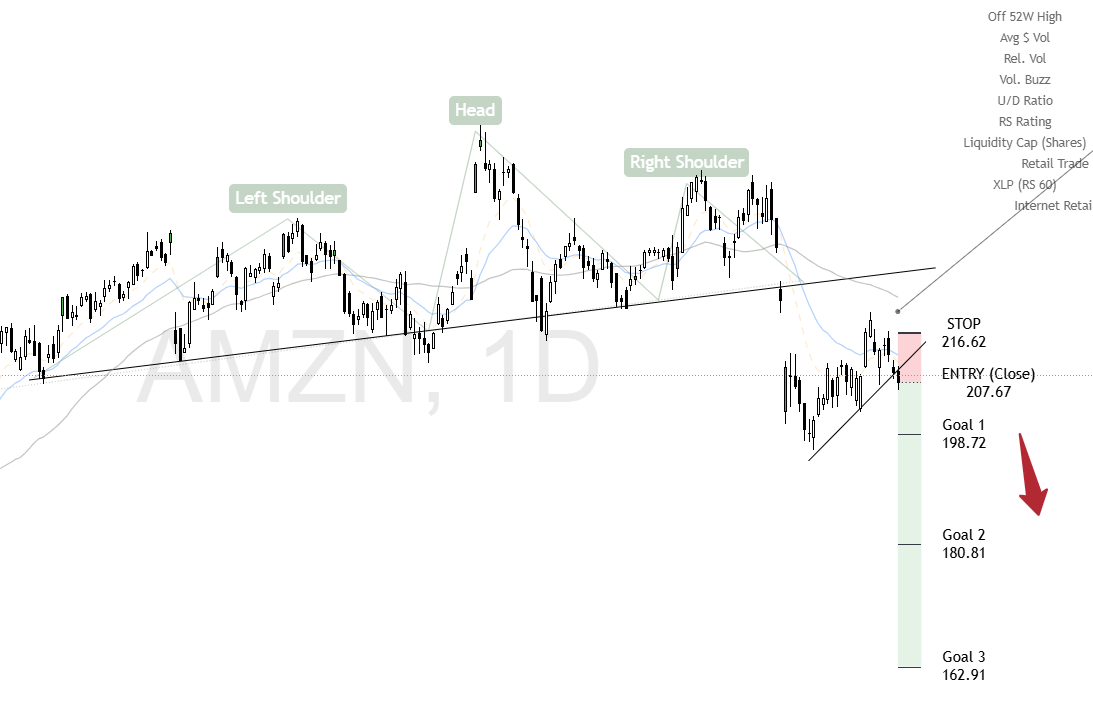
AMZN Daily
$SLI ( ▼ 1.84% ) – Shorting candidate
-
The Setup: The broader lithium group is failing, and $SLI ( ▼ 1.84% ) just suffered a massive failed breakout.
-
The Pattern: We are seeing an Inverse VCP (Volatility Contraction Pattern) breaking down from a 5-month base.
-
The Trigger: The stock tried to recover but was hard-rejected at the 50-Day MA. Prime short territory.
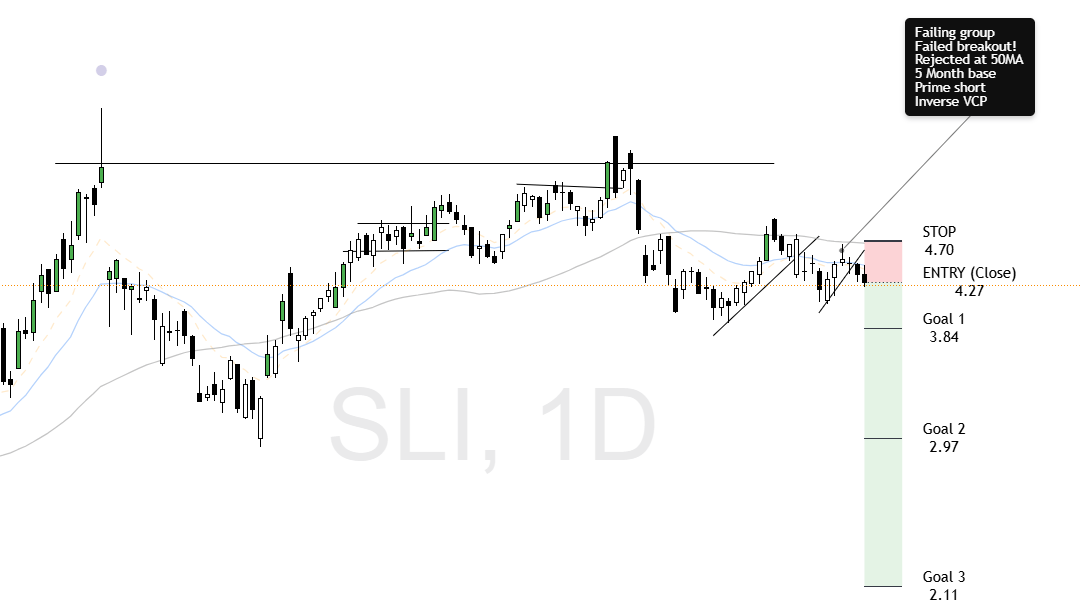
SLI Daily
$CRWV ( ▲ 1.57% ) – Shorting candidate
-
The Setup: A completely failed upside swing that broke down through a major long-term trendline.
-
The Pattern: Forming an inverted head and shoulders on the upside after a 3-month consolidation.
-
The Trigger: Currently executing a textbook pullback to a falling 20-Day MA.
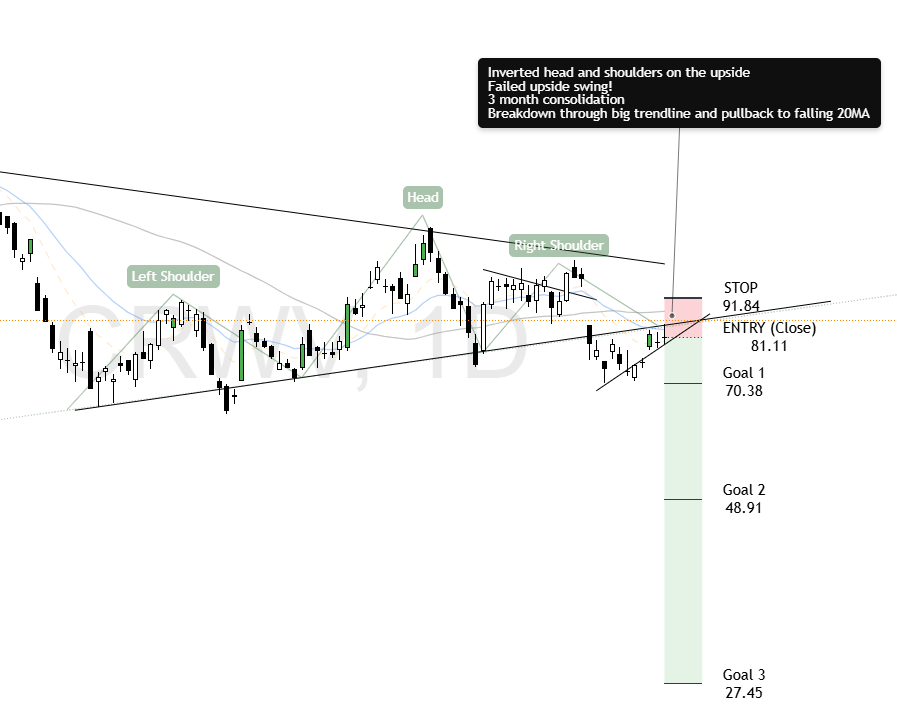
CRWV Daily
Data processing Short Candidates Right Now
$HUT ( ▼ 0.45% ) – Shorting candidate
-
The Setup: A completely failed upside swing that broke down through a major long-term trendline.
-
The Pattern: Forming an inverted head and shoulders on the upside after a 3-month consolidation.
-
The Trigger: Currently executing a textbook pullback to a falling 20-Day MA.

HUT Daily
$WULF ( 0.0% ) – Shorting candidate
-
The Setup: A completely failed upside swing that broke down through a major long-term trendline.
-
The Pattern: Forming an inverted head and shoulders on the upside after a 3-month consolidation.
-
The Trigger: Currently executing a textbook pullback to a falling 20-Day MA.
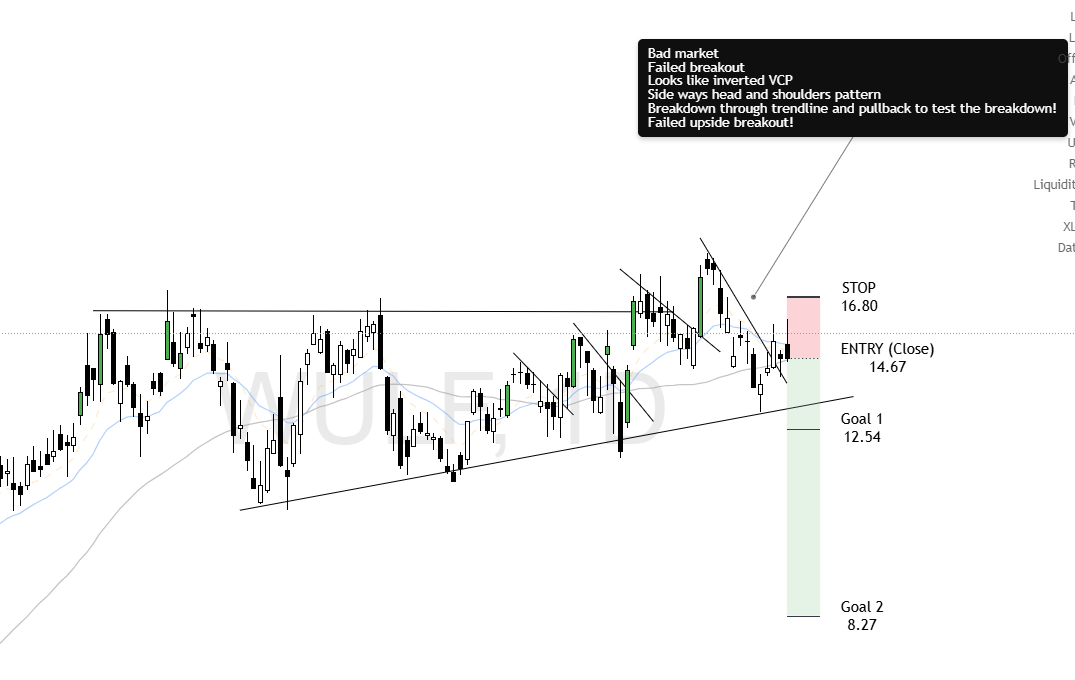
WULF Daily
📊 Trading Framework Reminder
Remember: Every long-term investment alert can also be played as a swing trade. When shorting, risk management is even more critical.
🦅 Long-Term Investors (3-12 Month Holds)
-
Entry: Full position on breakdown.
-
Profit Taking: Cover 1/4 to 1/5 at Goal 1.
-
Exit Signal: Close above 20-day EMA (your trend guide) or 50-day EMA.
-
Why? Strong moves are hard to time at the bottom, but the 20EMA acts as a reliable trend filter.
⚡ Swing Traders (2-6 Week Holds)
-
Entry: Full position on breakdown.
-
Profit Taking: Cover 1/3 at Goal 1.
-
Final Exit: Cover the remainder at Goal 2.
💬 How Did We Do?
We’d love to hear your thoughts on this week’s alert!
Was it helpful? Did anything stand out to you? Your feedback helps us improve and keep delivering top-tier insights.
👉 If you're enjoying your premium membership, consider leaving us a quick review — it means a lot!
Regards,
Valentine
